Focus on a Seleted Project
This page allows users to focus on a single selected project and explore its data in more detail. Once a project is selected, several features become available to help users examine its quality evolution, compare versions, and review project-specific insights, as described in the sections below.
Pick one project for further analysis
In the default dashboard, you could click on the project name, it will redirect you from the initial dashboard page (which displaying all projects, and their versions that have been uploaded) to the corresponding project page, which only focus on one specific project.
For example, in the initial dashboard, the user already uploaded 3 projects (Project 1, 2, and 3).
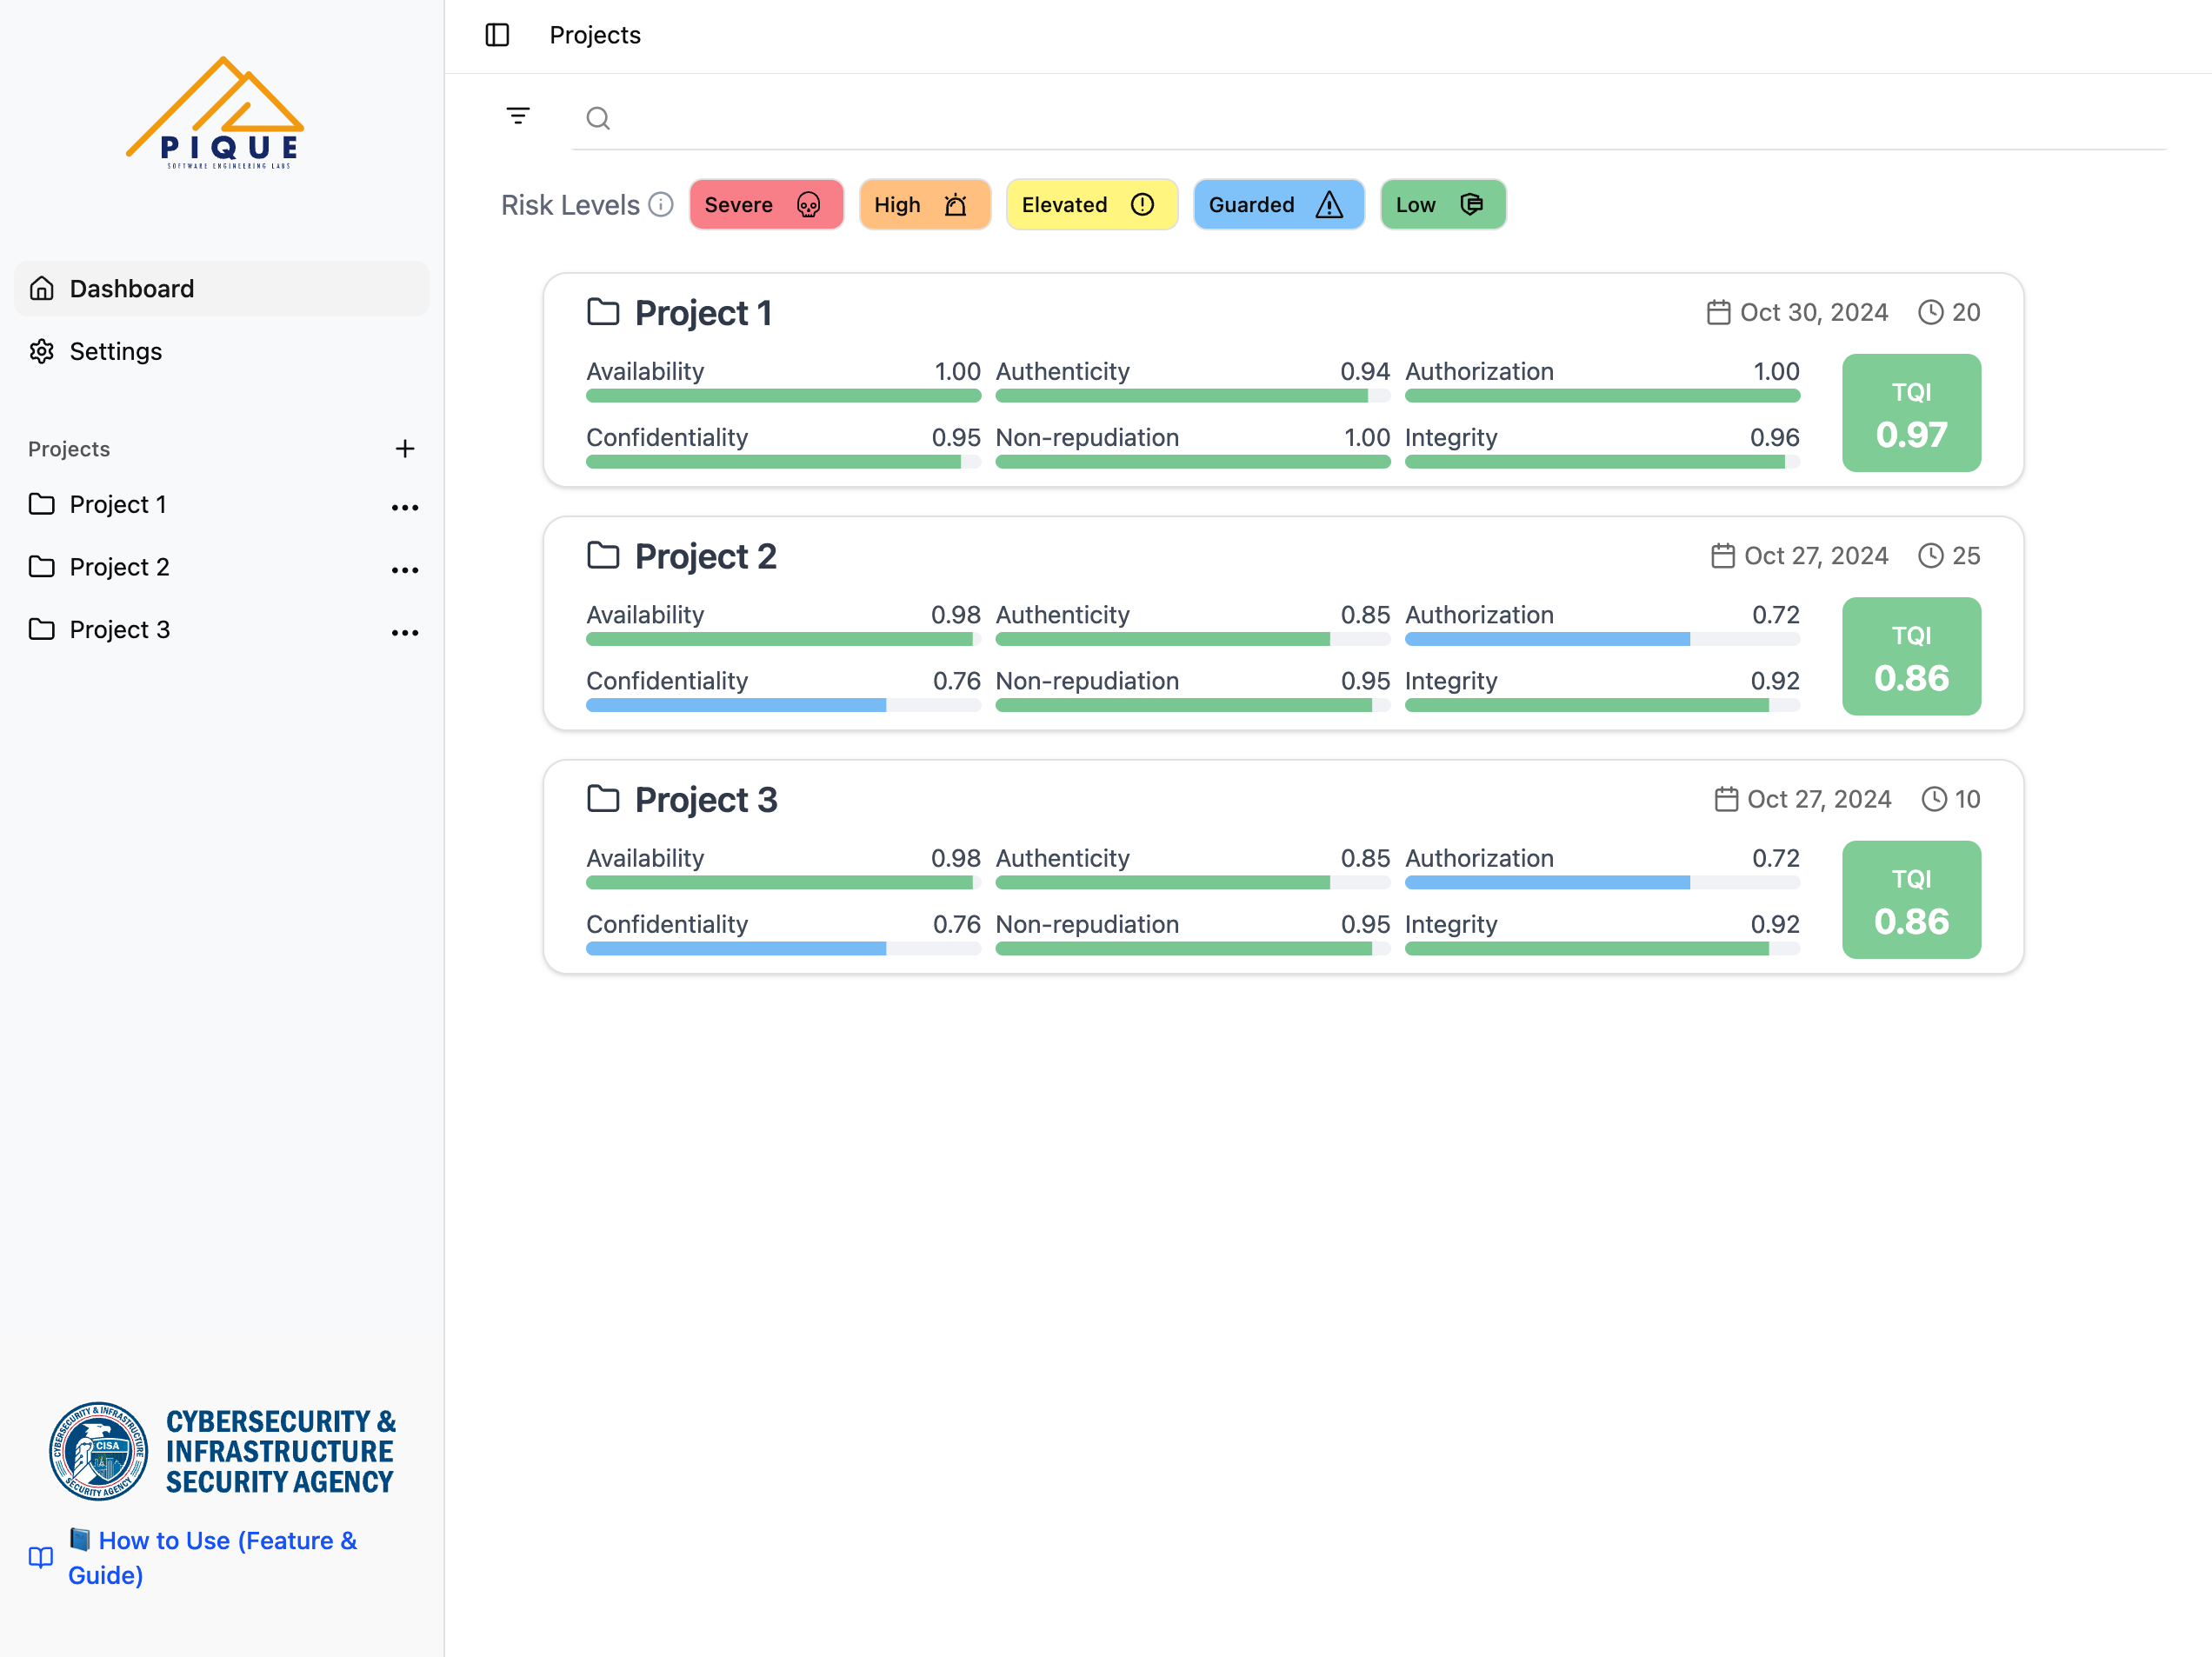
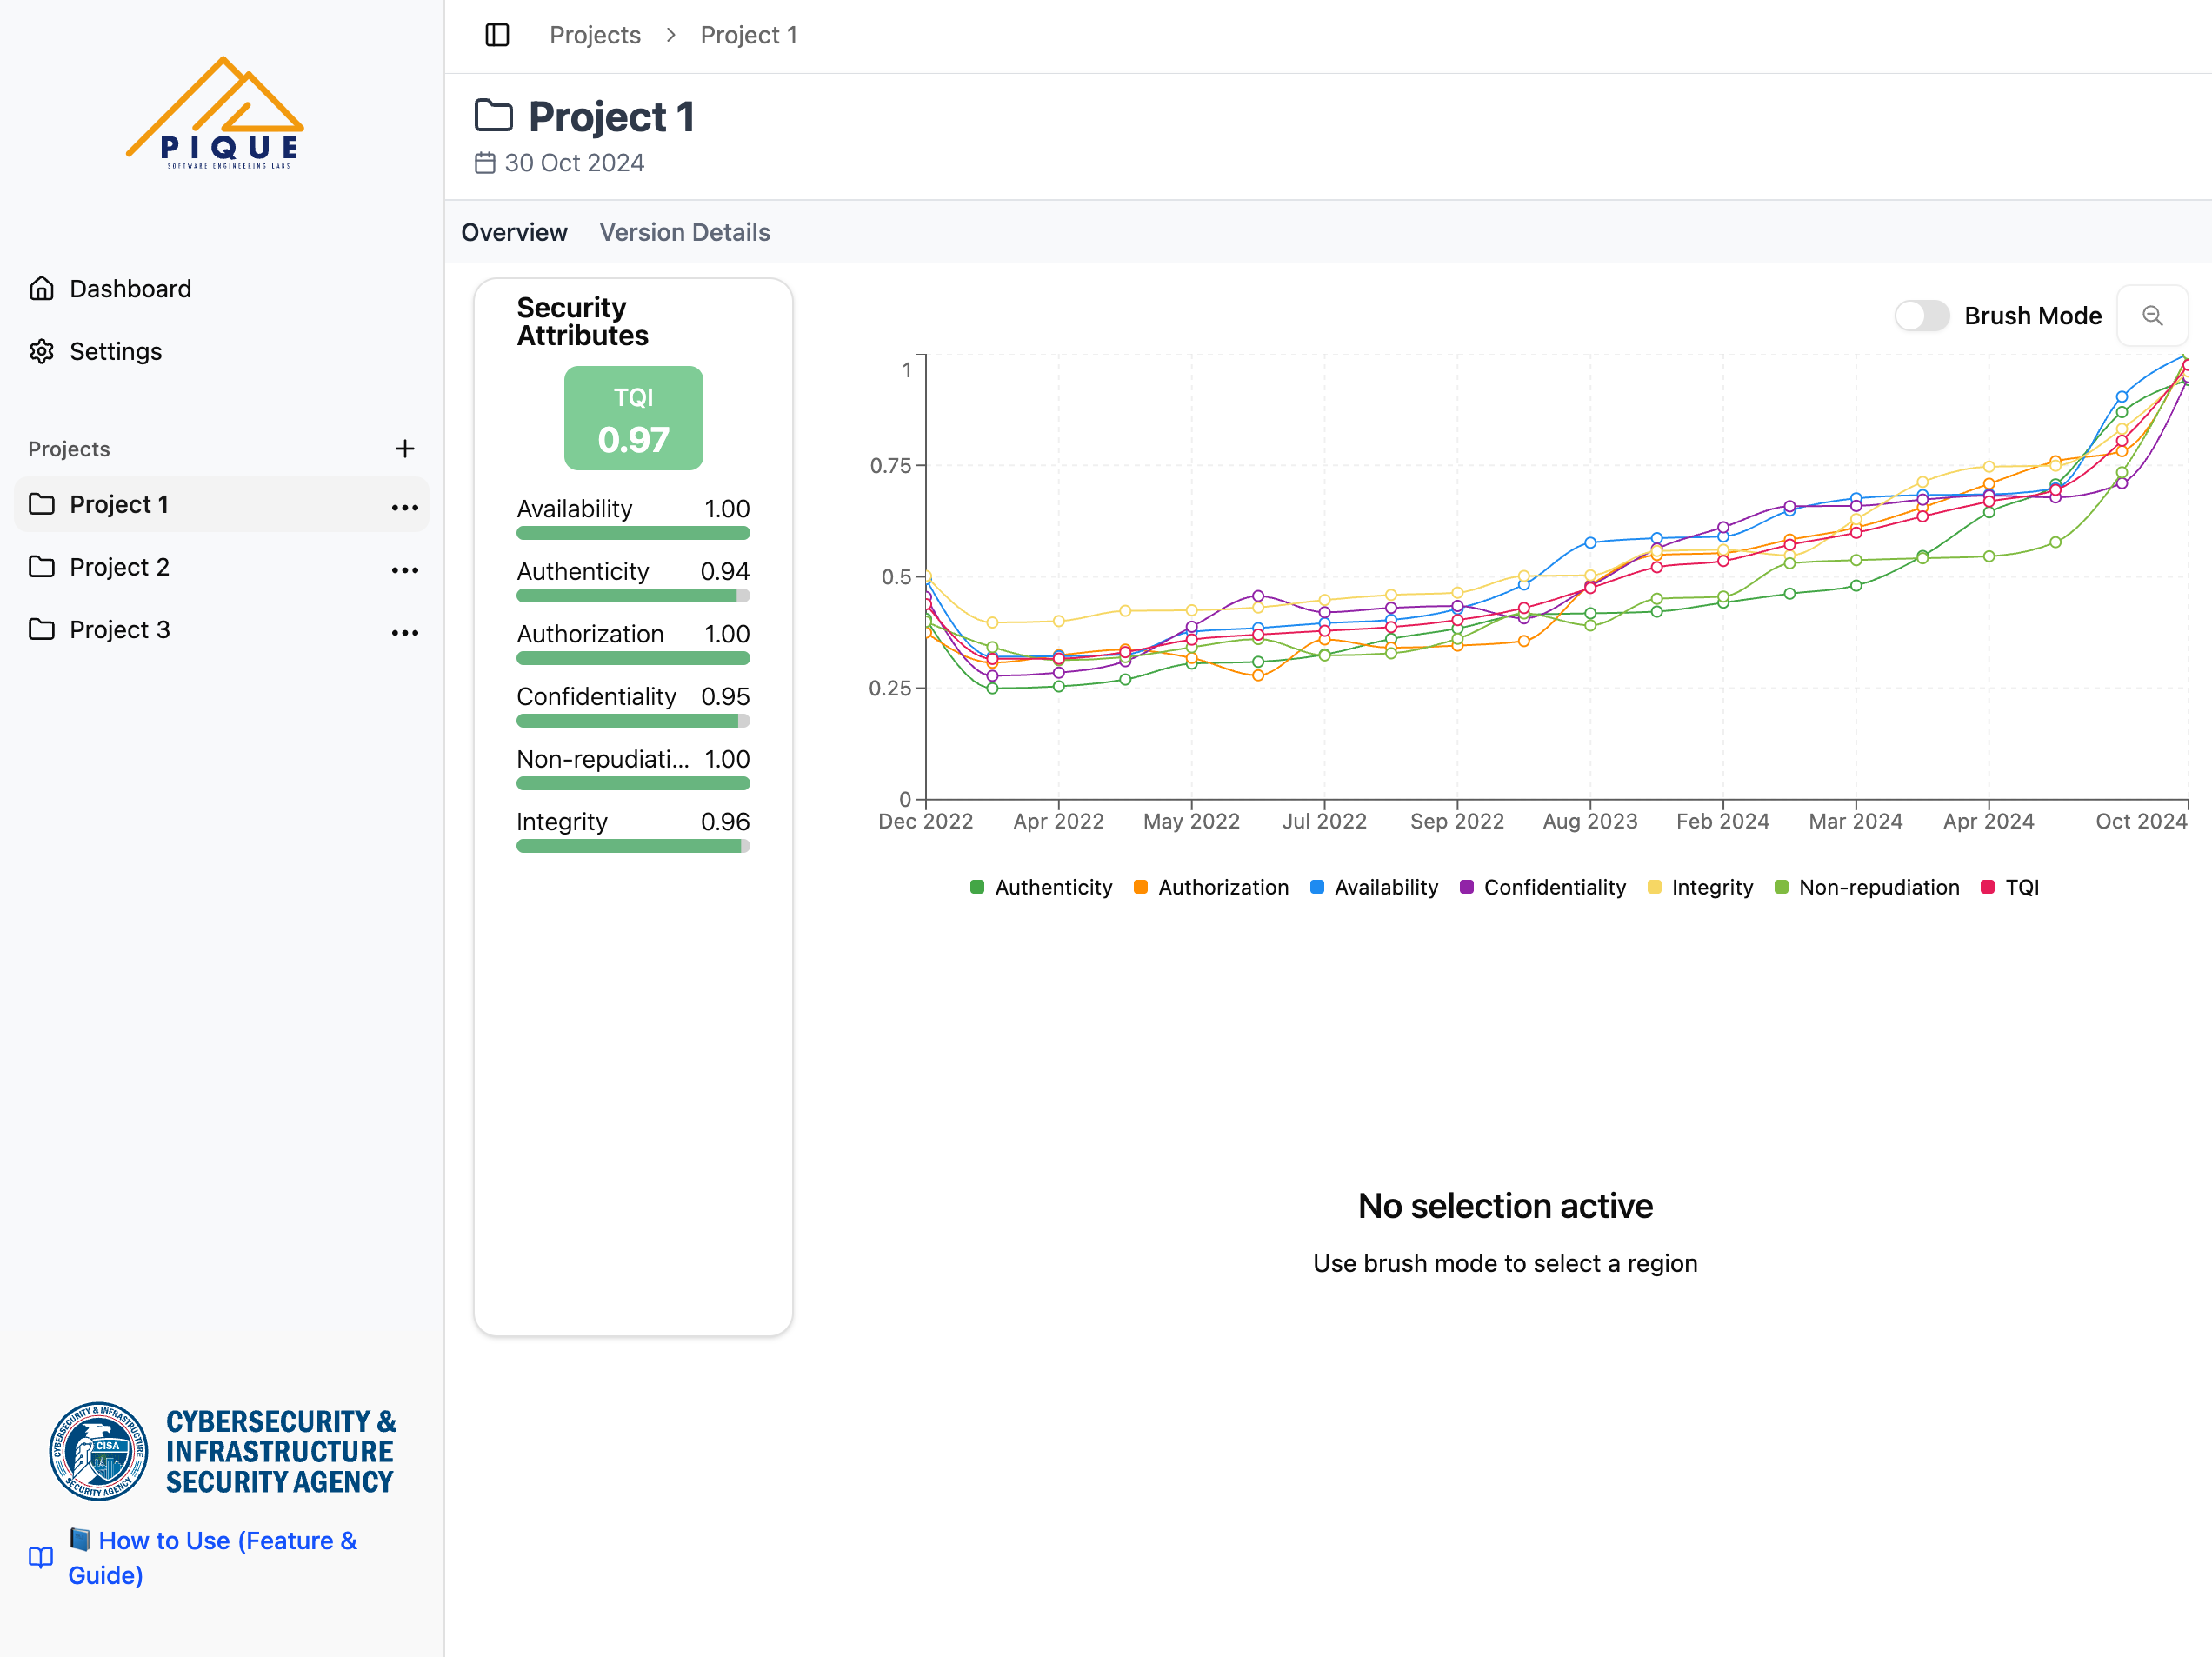
When users move their cursor over a project (e.g., Project 1), the card highlights with a subtle hover effect and the cursor changes to a hand icon, indicating that the project is clickable. Clicking the project card redirects the user to a page that displays data for the selected project only. This page contains two tabs: Overview and Version Details. The Overview tab is shown by default and visualizes how the quality aspects evolve across different versions of the project.
Understanding the Graph
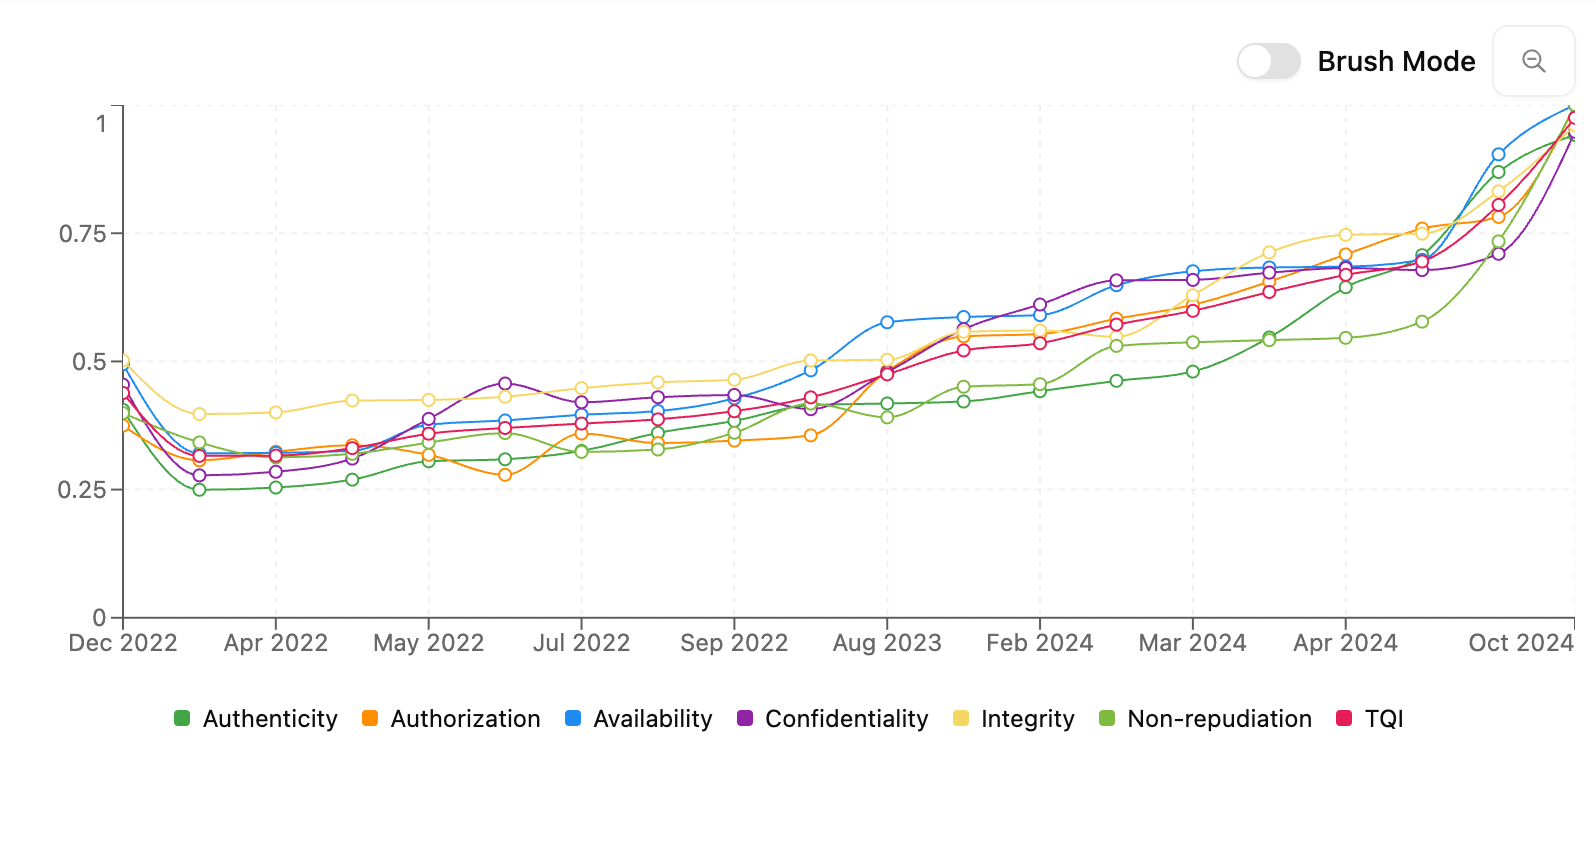
The graph displays six colored lines each representing a quality aspect.
Interacting with the Graph
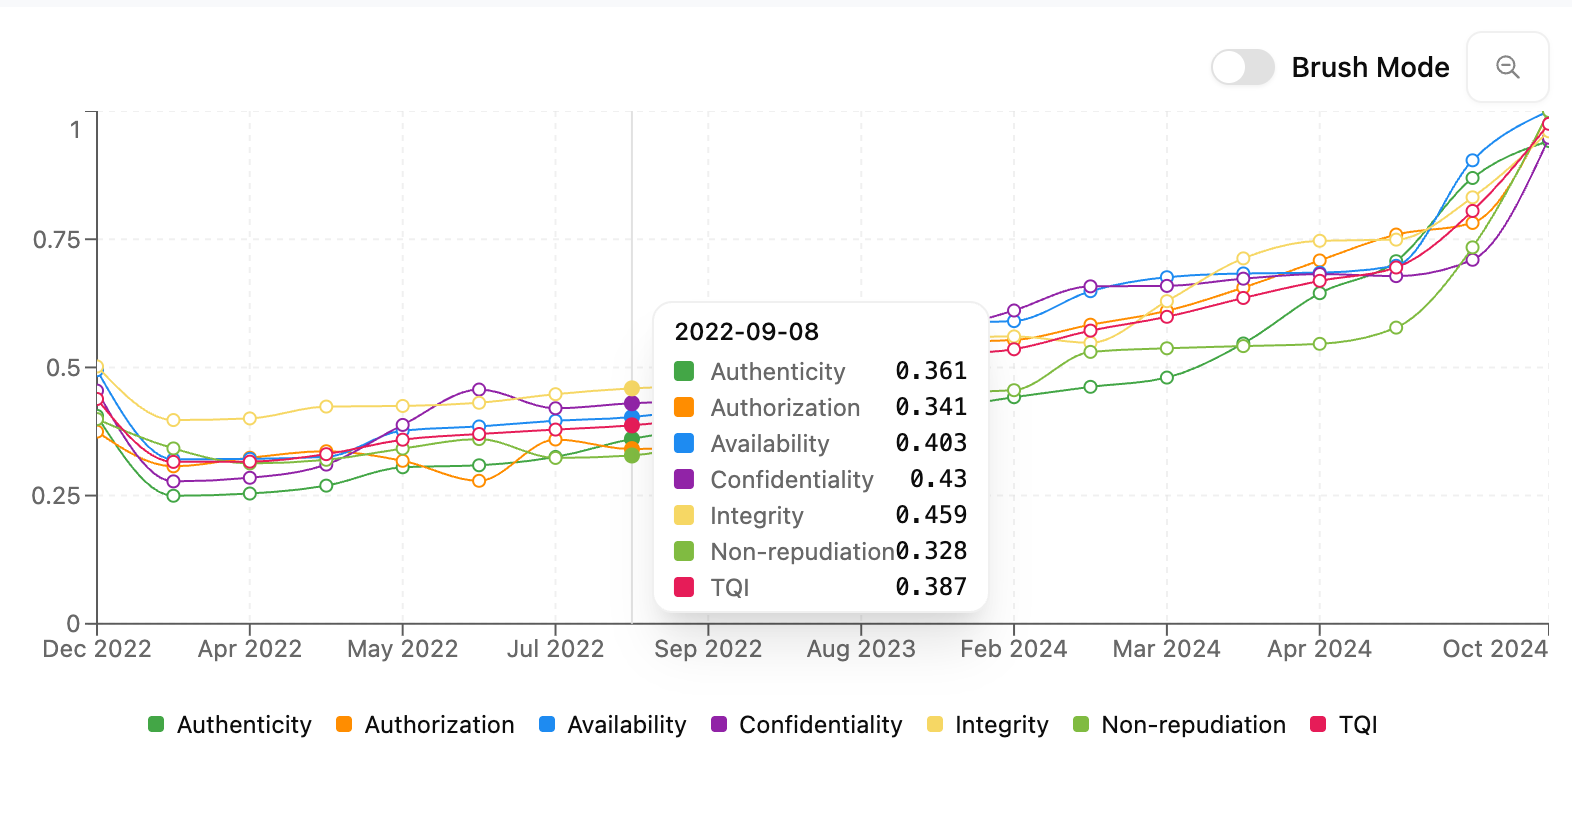
Hover for Detailed Information
- Move your mouse over any version to see the TQI and scores for all aspects
Zoom & Crop Feature
- Select a range of versions to zoom in and analyze quality trends more closely
- Click the Zoom Out Magnifier button to return to the full graph view
Viewing Versions and Selecting a Specific Version
Above the graph, you can switch to the Version Details tab to view the results of all uploaded versions of the selected project in a table view. The table will contains the Version name, created date, and exact scores of the TQI and all Quality aspects. You can sort the table ascendingly or descendingly based on the column you are interested in by clicking the sorting button next to each column title.
Once you decided to dive deeper into analyzing a specific version, you could click on the version name, and will be redirected to the page that provide more detailed in formation of this version. in this page, you could:
- Get an overview of the selected version. The Version Overview will walk you through the details on the version overview, providing different charts to interpret this version from various aspects.
- View the data in this version in a Hierarchical Tree Display or a Nested List Display.
- Perform Dynamic Adjustment to the Quality Aspects.