Version Overview
The Version Overview page provides a comprehensive summary of a selected project version. In this example, the page displays information for Project 1 – version_19.json. This view helps users quickly understand the quality status of a specific version and how it compares to previous versions.
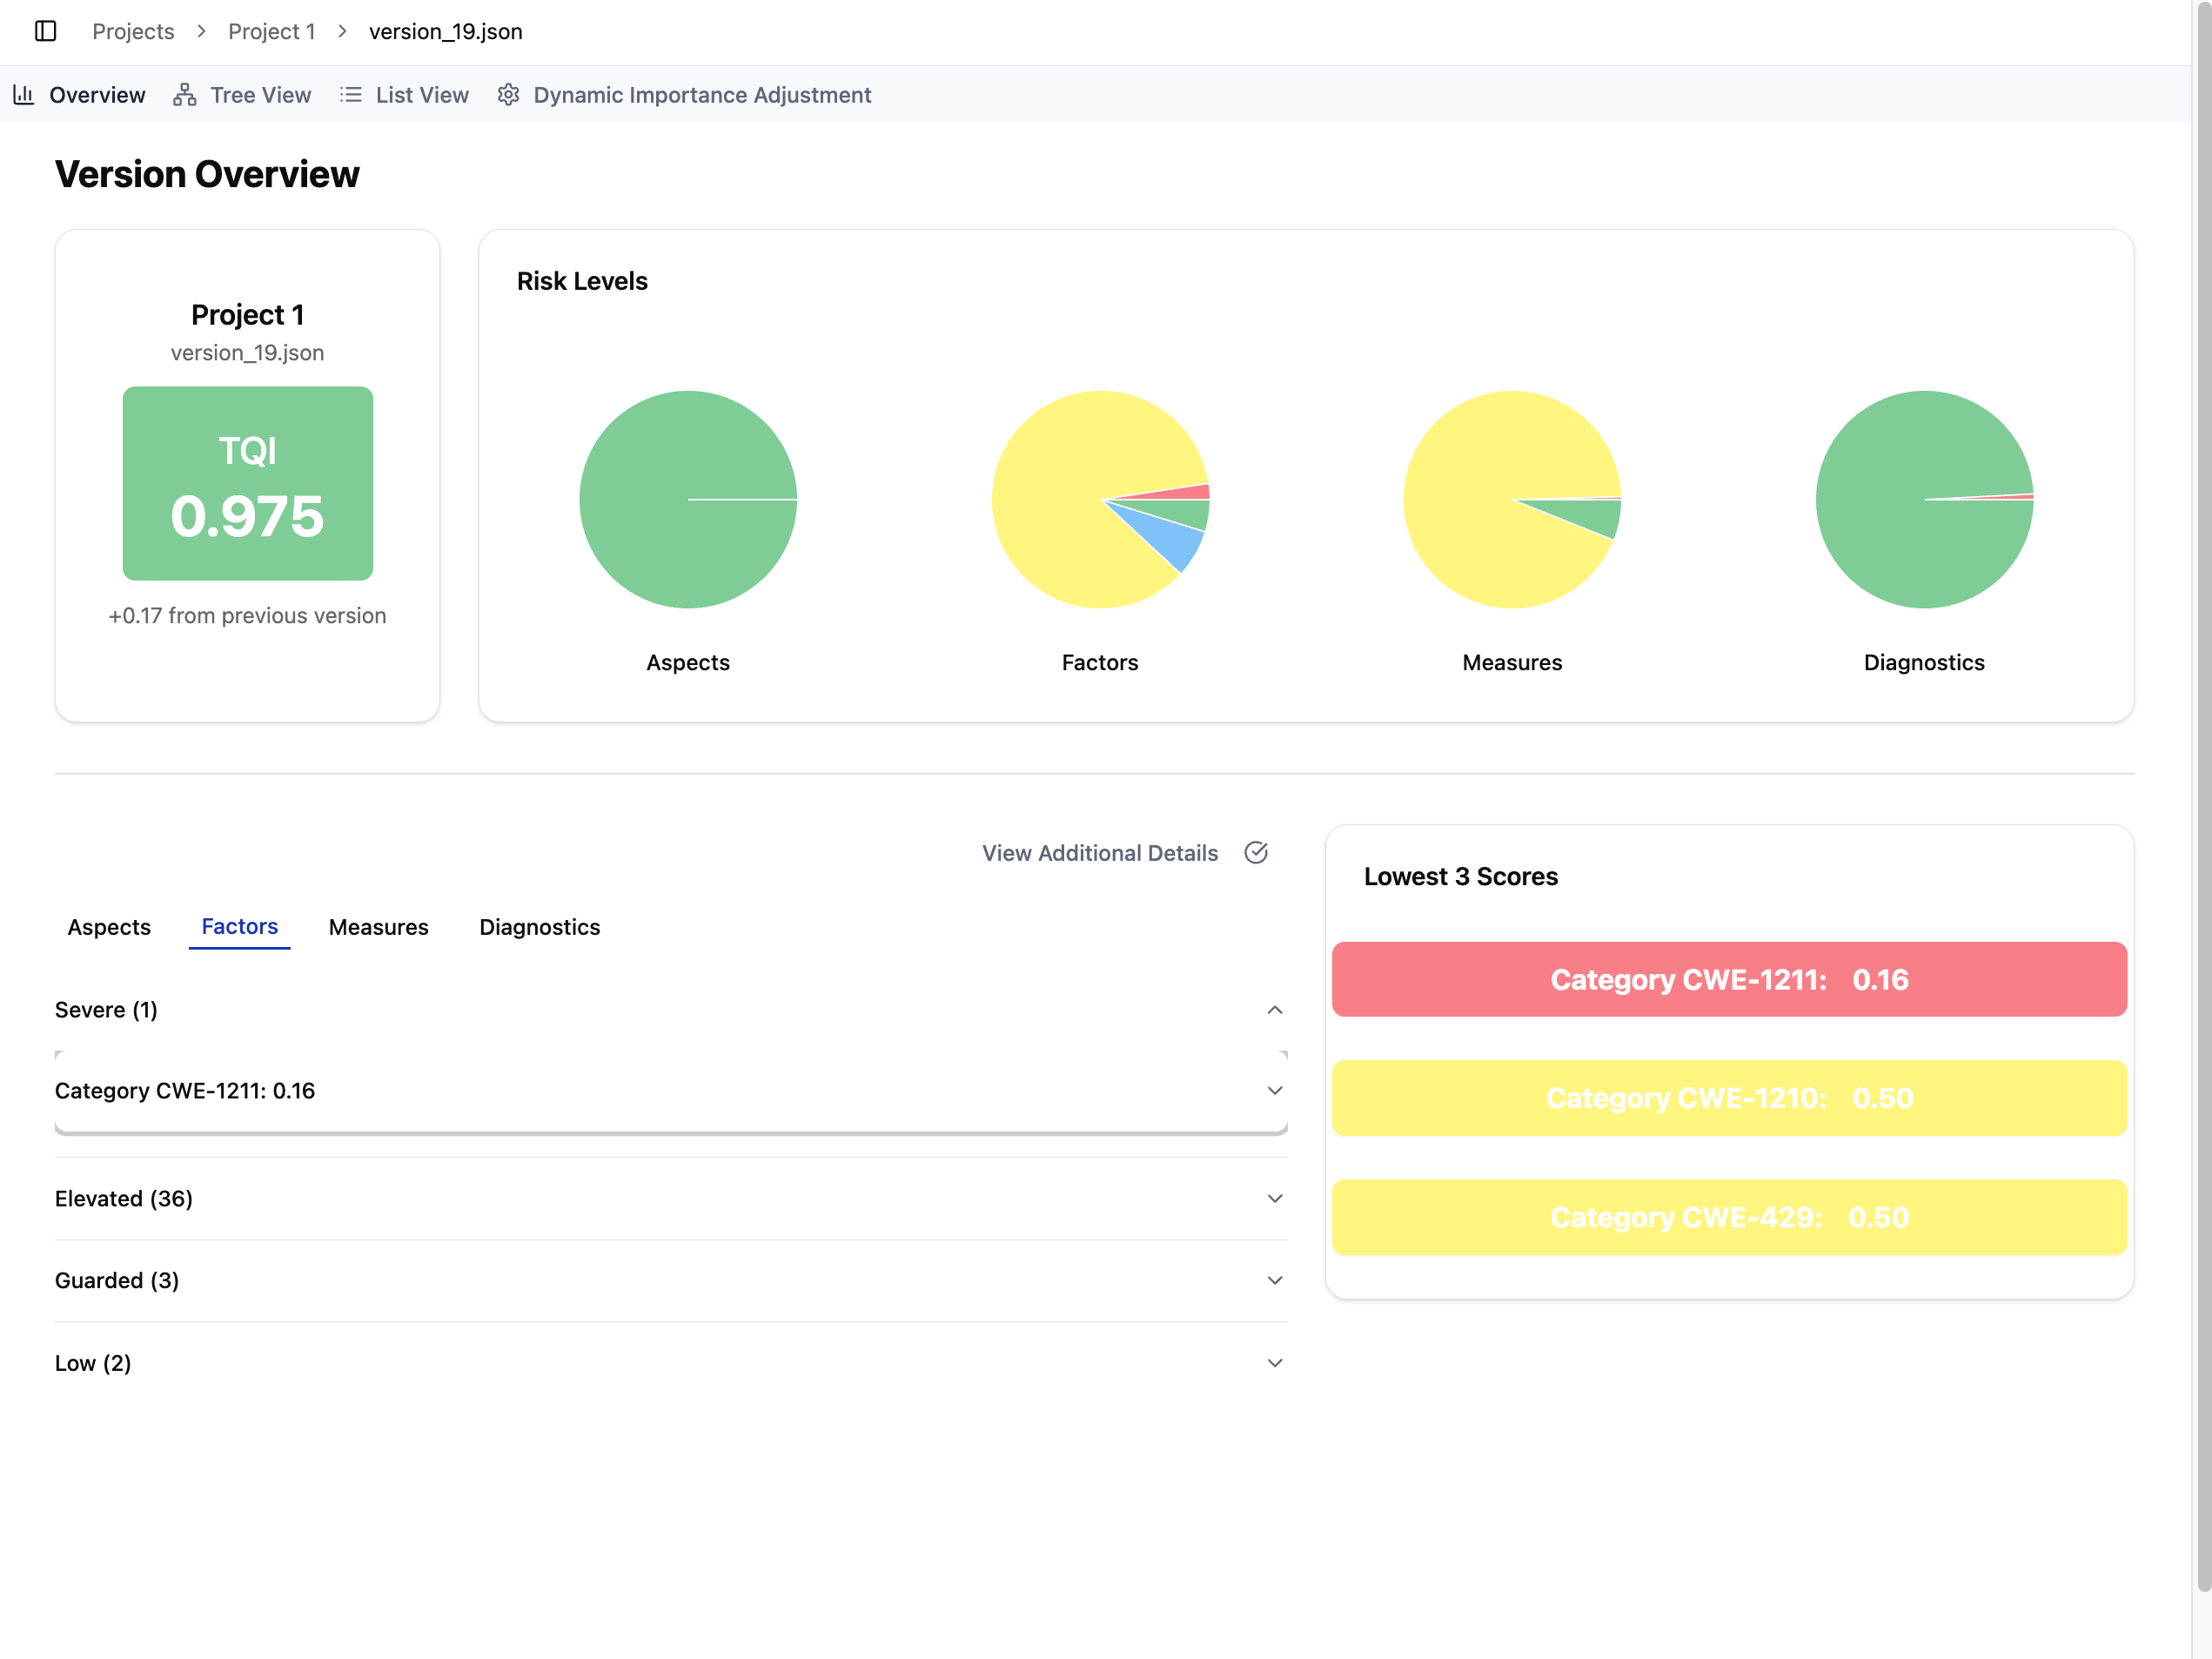
At the top of the page, the project card shows the version name, the overall TQI score for this version, and a delta indicator that reflects how much the TQI has increased or decreased compared to the previous version (e.g., +0.17).
Next to the project card, a set of four pie charts visualizes the distribution of risk levels across different parts of the quality model: Aspects, Factors, Measures, and Diagnostics. These charts summarize how many items in each level fall into each risk category, offering users an immediate, high-level understanding of where potential issues may exist.
Further down the page, users can switch between tabs (Aspects, Factors, Measures, and Diagnostics) to explore detailed results for each level of the model. Each tab contains expandable lists grouped by risk level, allowing users to drill down into individual items. When Additional Details is enabled, more contextual information is shown within each entry.
On the right side of the page, the Lowest Scores card highlights the three lowest-scoring items for the currently selected tab. For example, when the Factors tab is active, this section displays the lowest-scoring factors; switching to another tab will update the card accordingly.
Together, these components provide a clear and interactive overview of a project version’s quality, enabling users to identify issues and track improvement across iterations.